Nick Hodge,
Publisher
Dec. 29, 2025
Editor’s Note: What follows is the market analysis provided in the December issue of Foundational Profits. It foretold the positive growth and cooling inflation that has since been reported via GDP and CPI. These foresights are one of the reasons we’re ahead of the S&P by a factor of two this year, even as it broke multiple records. To get the related stock recommendations and allocations, follow this link. I wish you good investing in 2026! —Nick
Last month, I spent some time on why you should work on separating the economy from the stock market in your mind.
I noted, despite the correction in stocks we were witnessing at the time, we were in a bull market for stocks. I added that, again despite that correction, “what we’re witnessing is a melt up of asset prices as priced in cheap and weakening fiat currencies, driven by easy-money policies.”
We got another rate cut this month. And that melt-up continues.
Stocks, as measured by the S&P 500, are back within a reindeer’s whisker of all-time highs, now up ~17% for the year, which is quickly approaching its end.
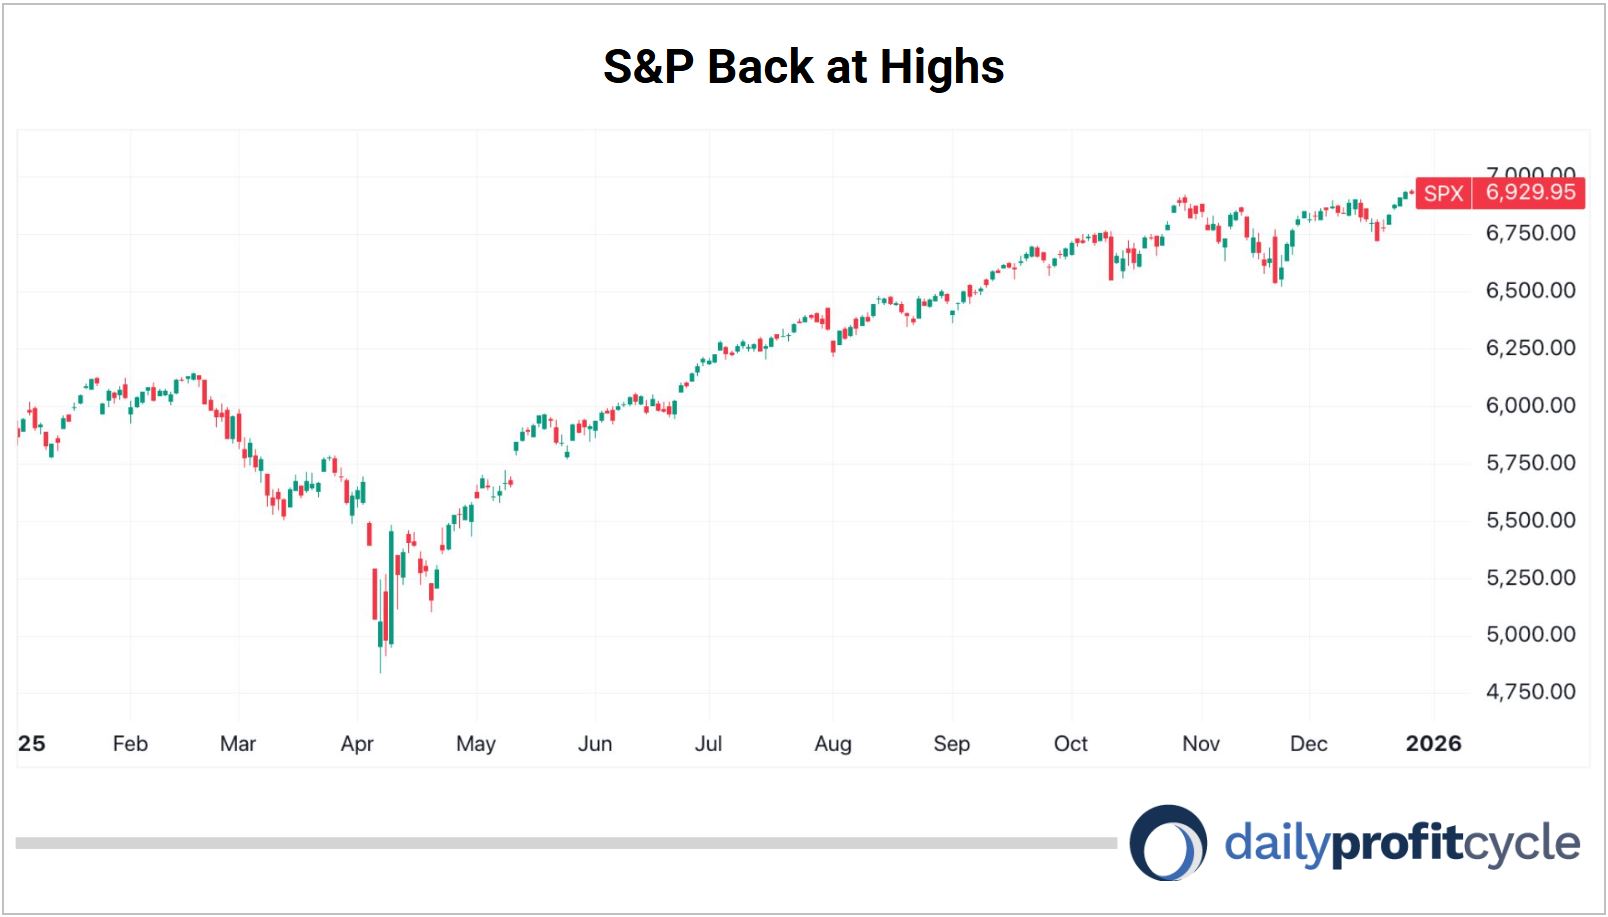
Expect new highs in the New Year, driven by continued economic growth (GDP) that is positive for Q3 and will be again for Q4.
And driven further by stable-to-moderately-cooling inflation, which is hard to believe for grocery shoppers but not for truckers. Here’s a look at the input weightings for the Consumer Price Index:
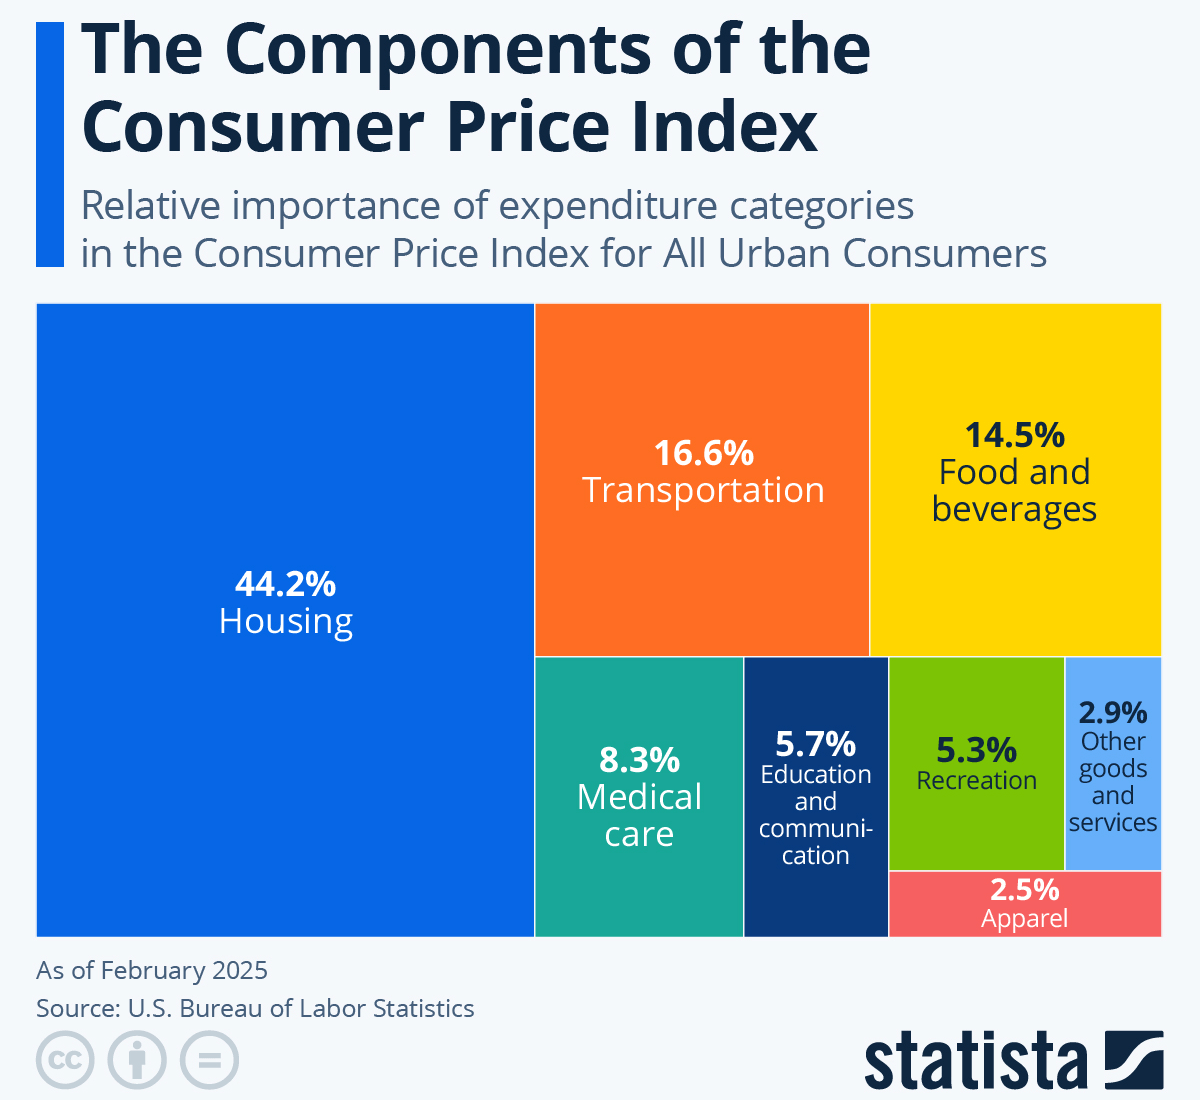
Housing accounts for over a third of the index. And it’s calculated using rent prices, not home prices, as the former is viewed as a consumption item while the latter is viewed as an investment. Even though many folks think the ‘rent is too damn high,’ and are voting for pro-rent control politicians, prices are actually coming down. (This is another lesson in separating the emotions of the economy from the mathematical reality.)
According to a December 2nd CNBC article:
A slew of new supply is still making its way through the multifamily housing market. That, coupled with weakening demand, especially from the youngest workers, is pushing vacancies up and rents down.
The national median rent for apartments fell 1% in November from October, and now stands at $1,367, according to Apartment List. It was the fourth consecutive month-over-month decline. Apartment rents are down 1.1% from November 2024 and have fallen 5.2% from their 2022 peak.
So the biggest input to the CPI is falling.
And so are components to the second-biggest input, transportation. That number doesn’t include oil (though the PPI does), but it does include gasoline and diesel prices for which the trend is down and to the right for the past few years.
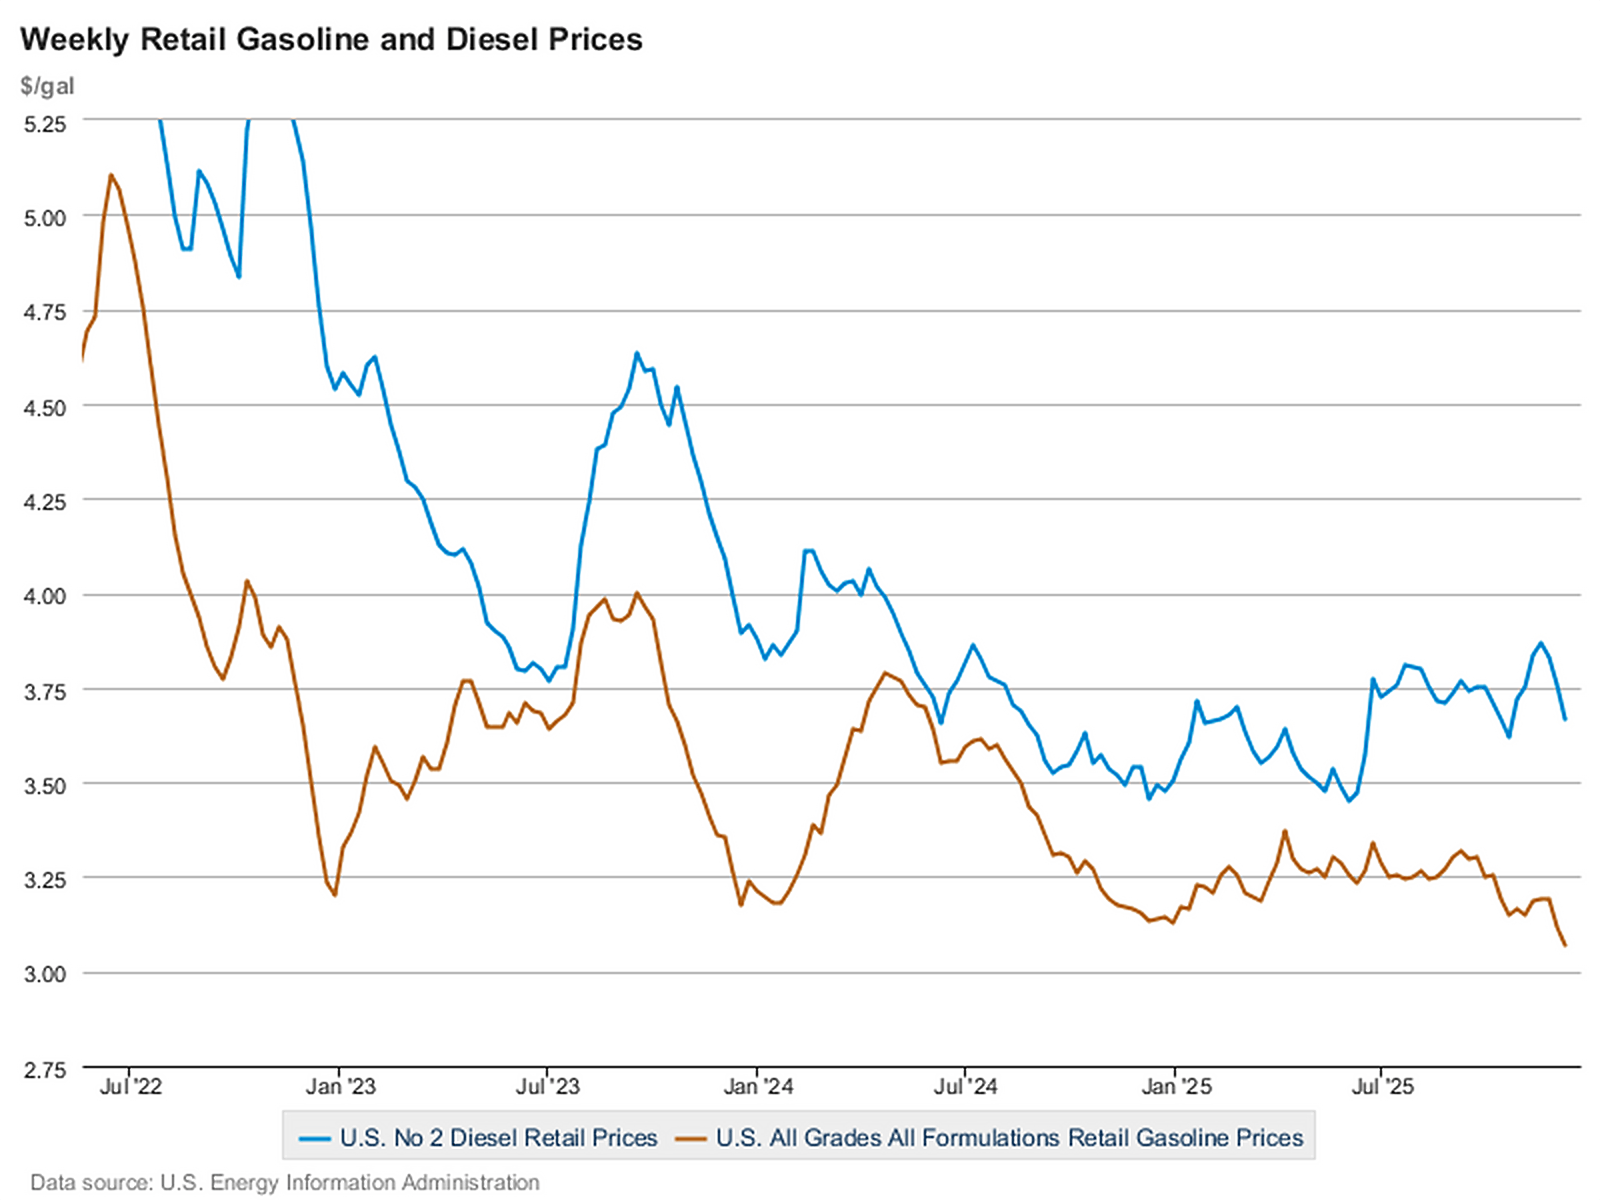
(Another word here on that separation theme: Are gas and diesel prices much higher than they were pre-pandemic? Yes. Are they a burden for middle and lower classes? Also yes. But has the number that gets put into inflation and Wall Street algorithms that generate bullishness and buying been going down? Again, also yes. Three true statements that you need to be able to separate to be a market-beating investor.)
The same disinflationary pattern is true for oil on the industrial input side of things, which gets fed into the Producer Price Index. I’ve shown you this chart a few times in the past few months, and the trend continues to be down and to the right.
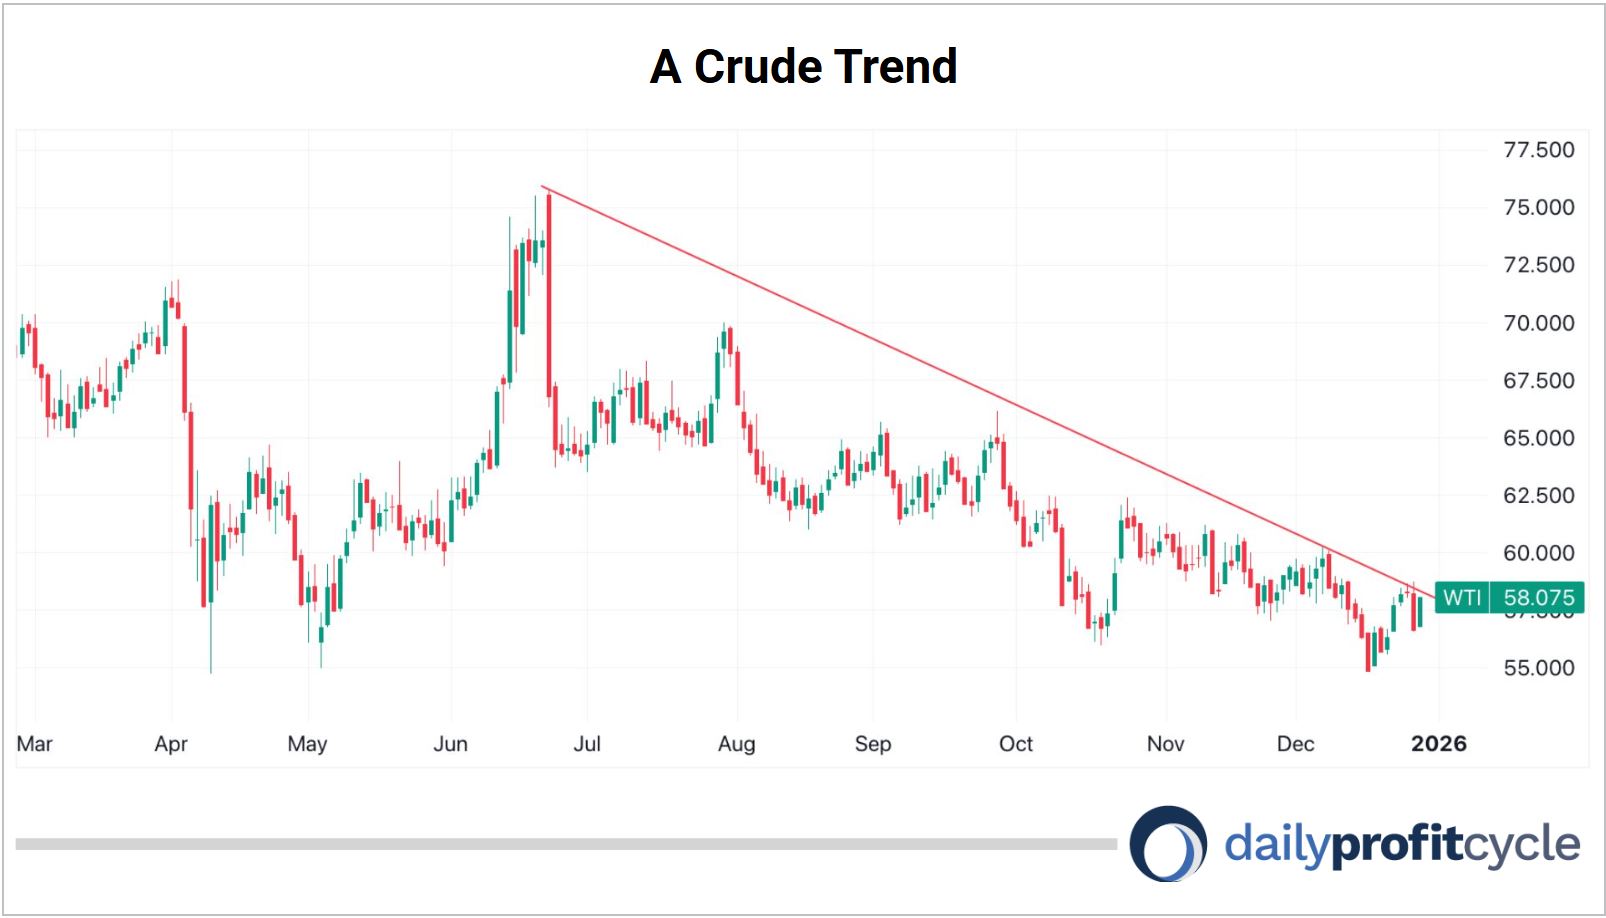
Political partisans and Twitter Cassandras might say something like: “Oil falling means the economy isn’t growing.” Investment pros like you should respond that falling cost inputs are bullish for many sectors, and growth projections for the current quarter don’t reflect any major contraction. Additionally, the stock market is at all-time highs and not pricing in any sort of recession. And market dynamics have proven that when inflation falls or abates — even if prices are historically high — relative to flat or expanding growth, it’s a bullish setup for broader equities.
Moving away from growth and inflation to other major signals we see further green lights ahead.
The dollar continues to show its inability to get up off the mat. It did strengthen from mid-September through early November, moving from 96 to just over 100 on the DXY. That was a major contributor to the stock correction we saw in the period. Now, with a dovish Fed back in flight and the restarting of QE, it has quickly reversed course back down to 98. And with the Trump administration hellbent on installing a dovish loyalist as the next Fed Chair, I wouldn’t hold my breath for a stronger dollar in 2026. It takes more weaker dollars to buy things like stocks and commodities, so expect higher prices for those things ahead.
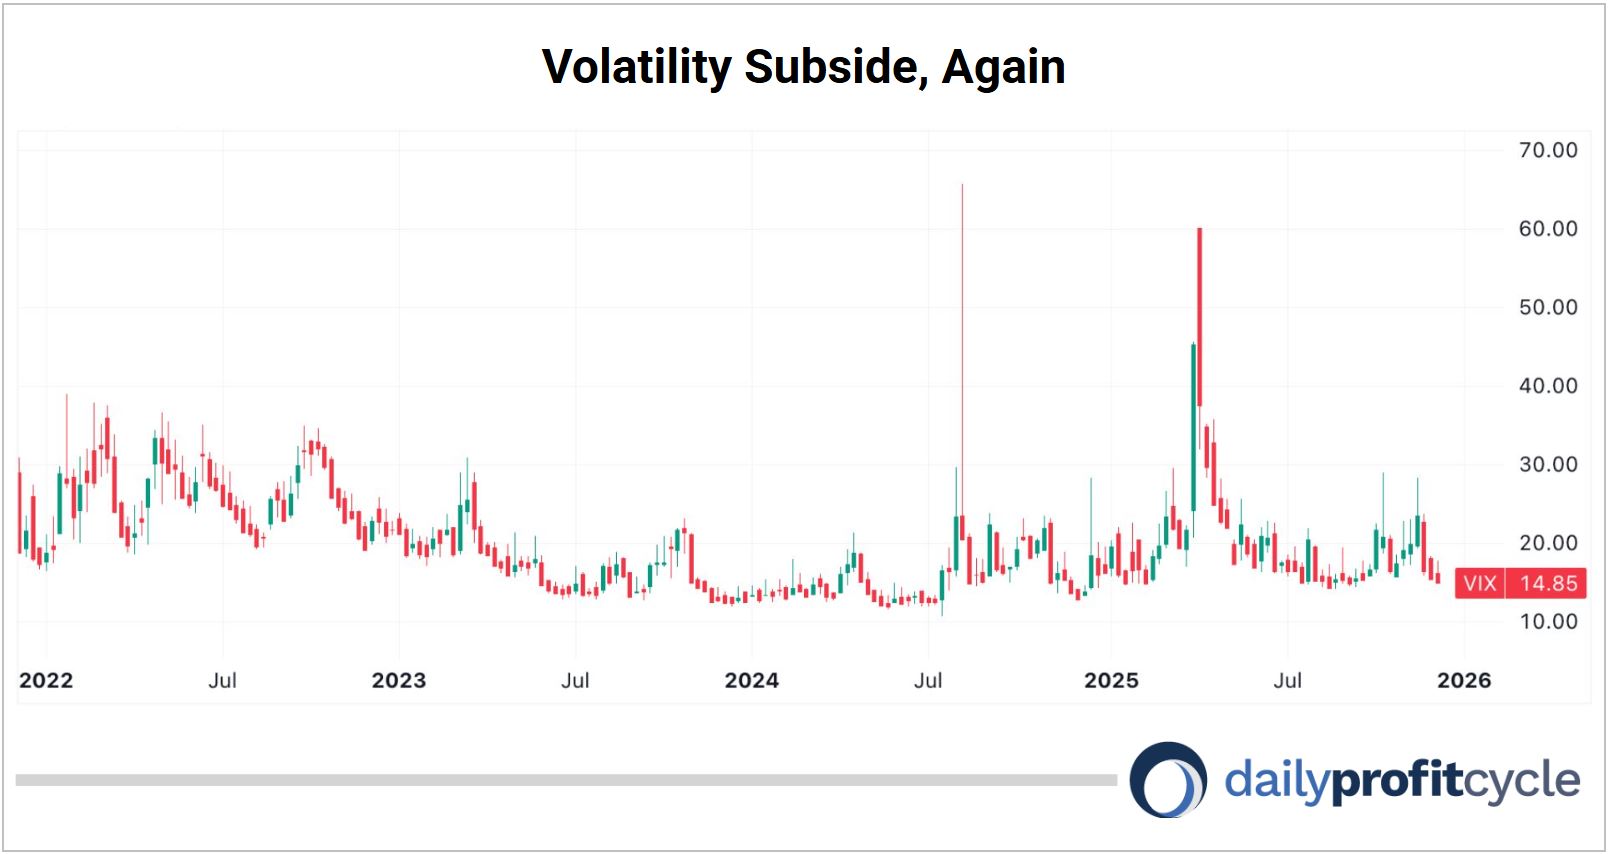
And the last word is on the S&P Volatility Index (VIX), which spiked to 60 earlier this year after Trump’s tariff-fueled Rose Garden ceremony sent shockwaves of fear through global trade and stock markets. It then cooled to 14 as the summer heated up, only to spike again briefly in October and November amid the government shutdown and aforementioned stock correction. Though the volatility of volatility has been higher since the unwinding of the Japanese Yen carry trade back in Summer 2024, as you can see by wider candles and longer wicks, we are once again back down in the 14s as of this writing, portending a continuation of S&P bull market as we head into the new year.
(You just read a section of the December issue of Foundational Profits, which members received two weeks ago. That portfolio, which is a reflection of how I manage my long-term portfolio, has outperformed the S&P twice over this year. To get all the stock recommendations and suggested allocations that come with it, follow this link.)
Call it like you see it,

Nick Hodge
Publisher, Daily Profit Cycle