Nick Hodge,
Publisher
Aug. 12, 2025
Editor’s Note: Please enjoy the excerpt below from the August issue of Foundational Profits. You’ll see my current market analysis and track record for 2025. We are beating the S&P several times over for the year. You can see all our closed positions below. You can become a member of Foundational Profits to get all the open positions, as well as the eight new recommendations I made in the August issue to position for the end of the year and into 2026. Details here.
From the June issue:
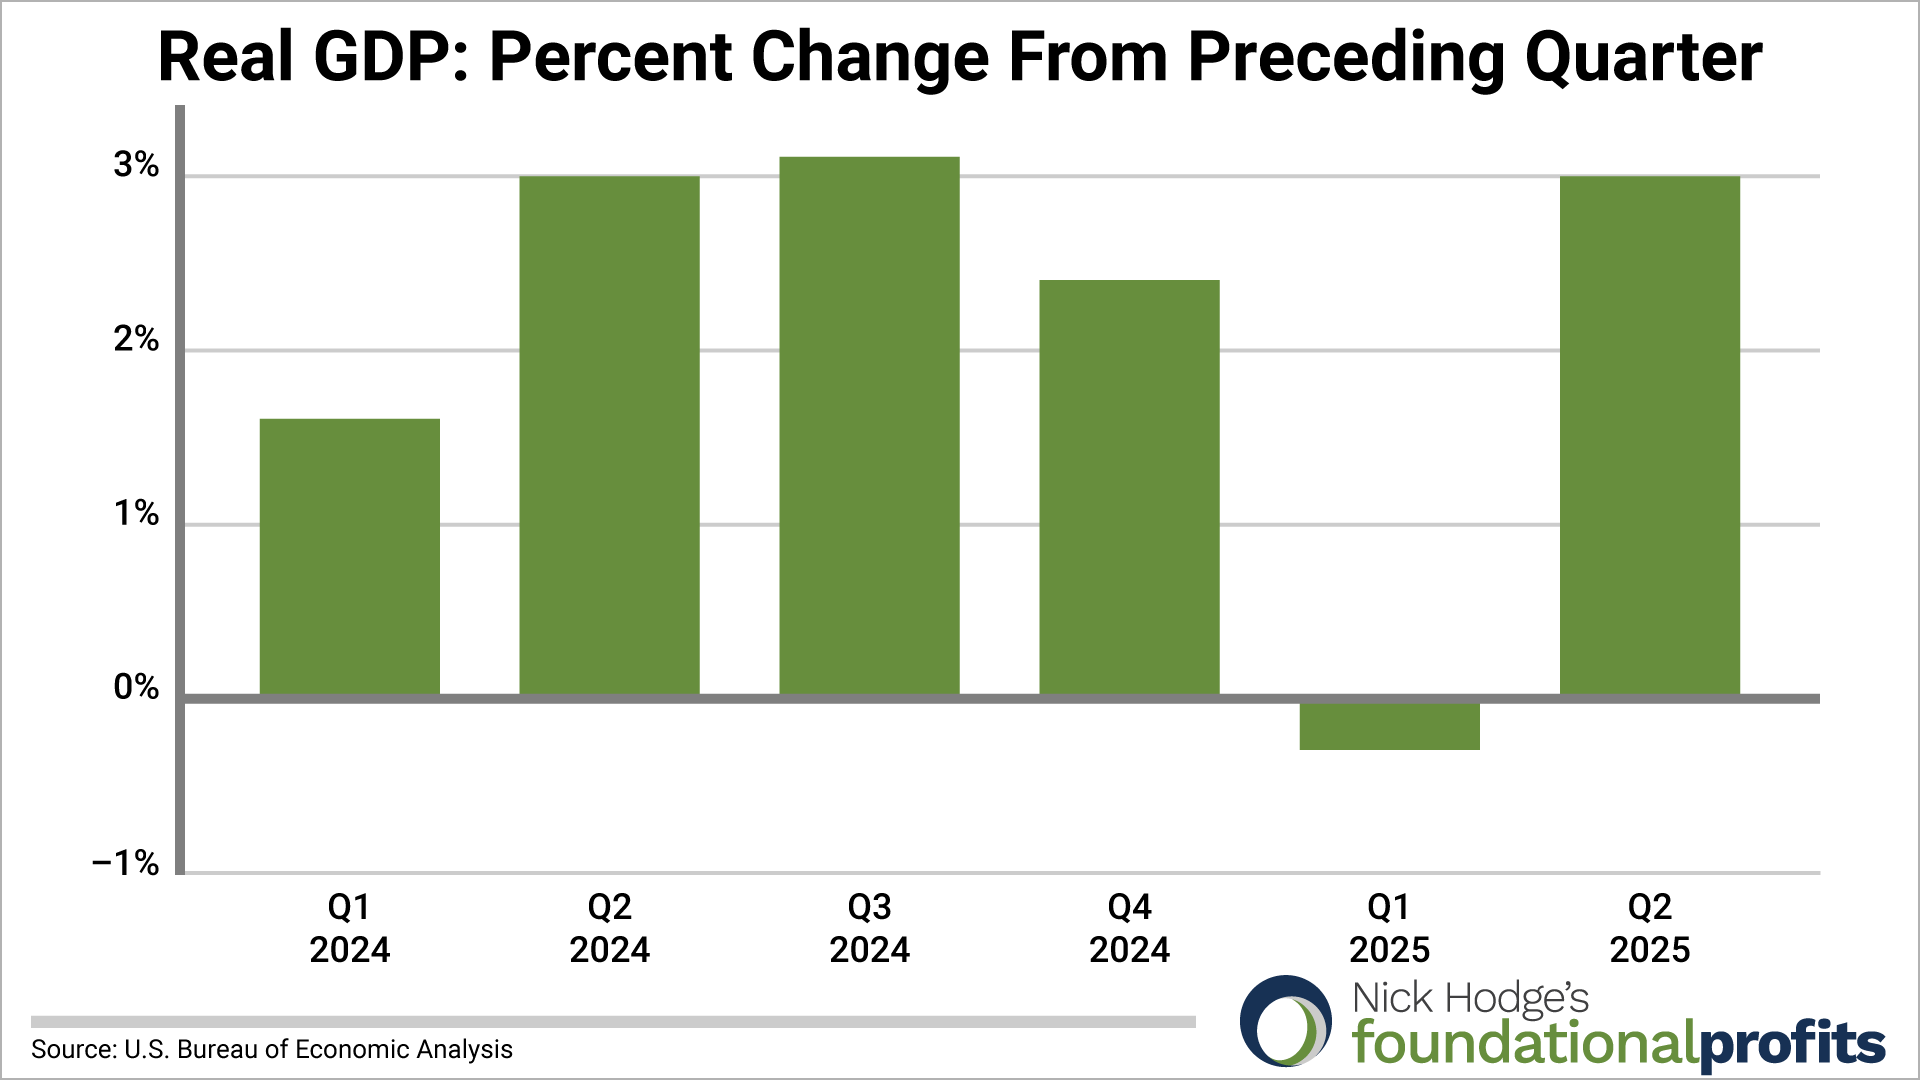
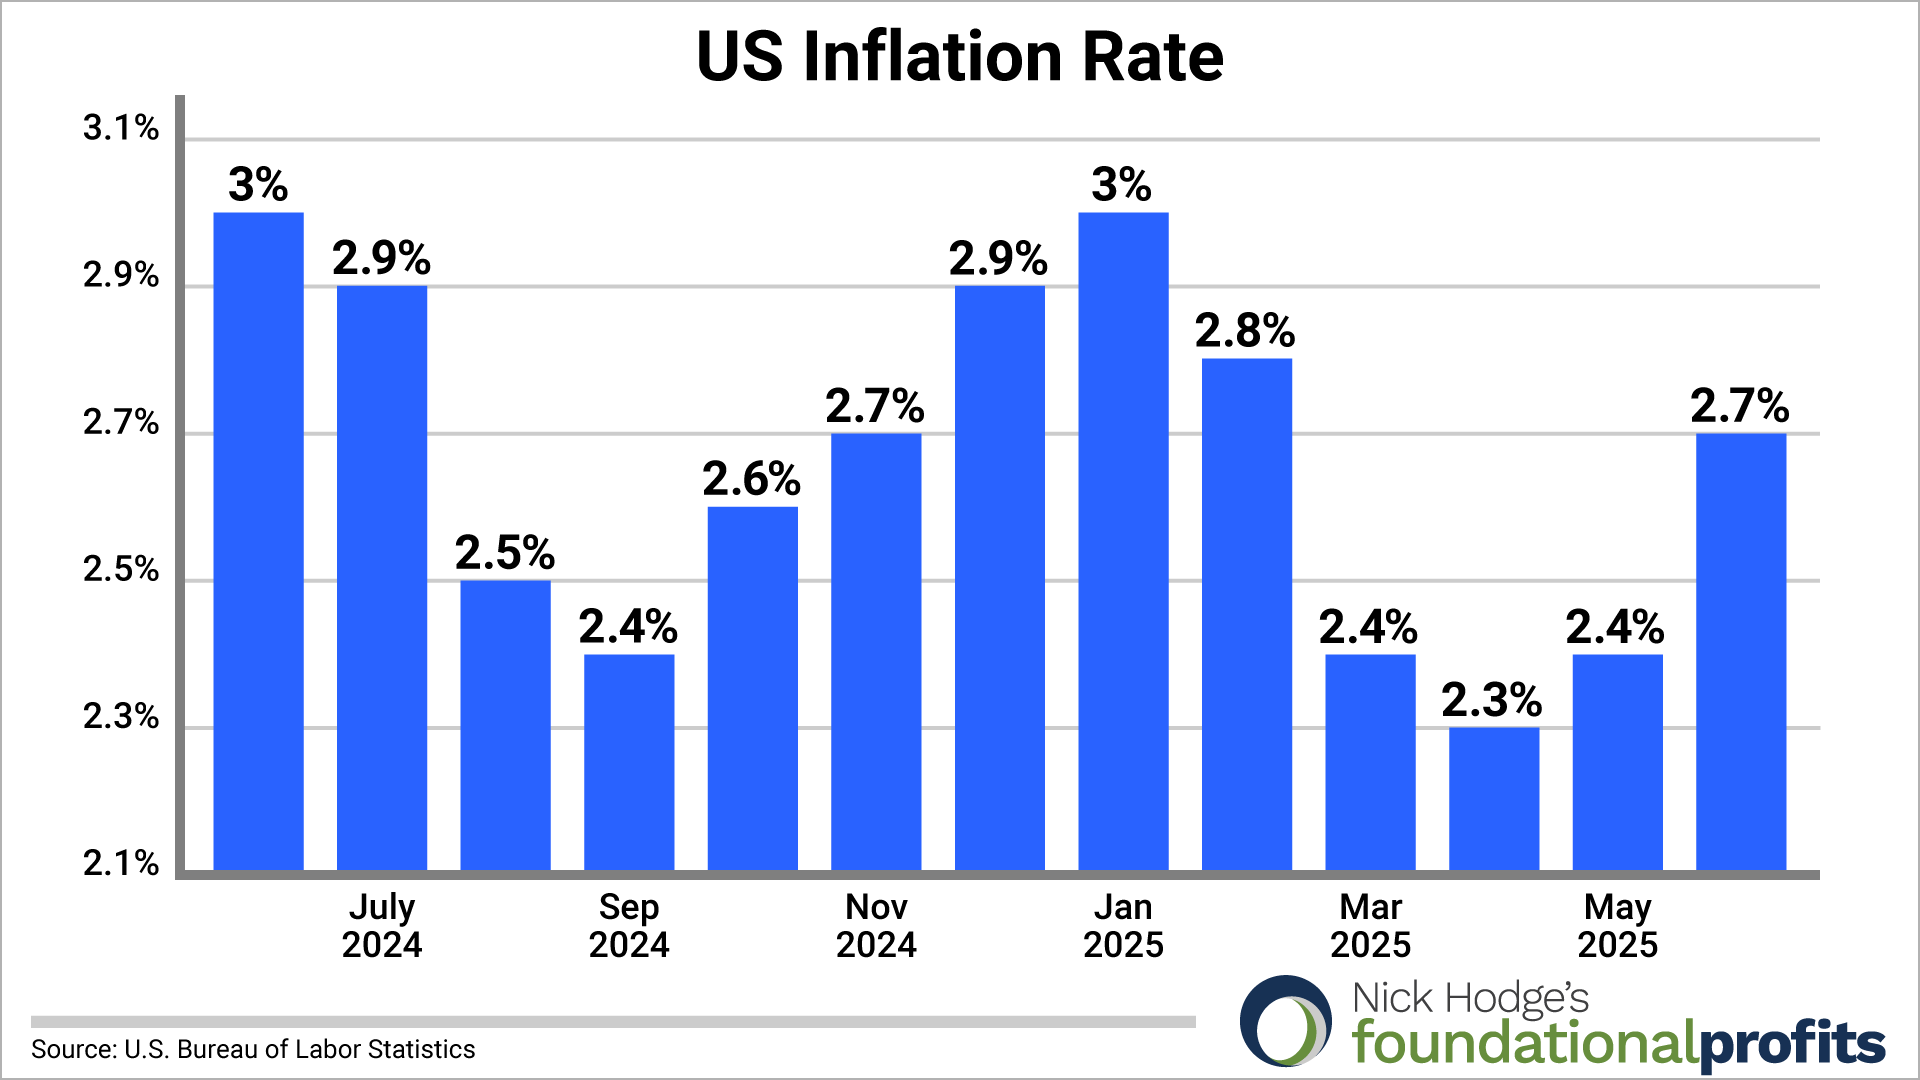
The first half of the year saw falling US economic growth — from above 2% GDP in Q4 2024 to -0.3% in Q1 2025. The stock market did not like that slowdown as clearly evidenced by an S&P 500 that was down more than 17.5% year-to-date through the first week of April as many investors were liberated from their gains. But despite tariff fears and talk of recession, we’re going to be back in positive territory for the remainder of 2025. You can expect inflation to tick back up as well. The inflation rate has started to tick back up… with the May print coming in at 2.4%. Given rising commodity prices, we can expect it to be higher again in June. Stocks generally like when the rate of change of growth and inflation are moving higher together. And that’s what we’re seeing now. As I expressed in multiple issues earlier this year, the real threat to the economy and stock market was Trump doing what he said in terms of austerity, spending cuts, and dogged efficiency. Instead, and as predicted, the DOGE has been sent to live on a farm in the country while the kids in Congress pass big, beautiful bills that will add billions more to our debts and deficits. The irony is it’s that very spending that will keep GDP positive and the US out of recession.
Let’s unpack those bold blurbs.
Indeed, US gross domestic product for the second quarter surged to 3.0% as reported by the Bureau of Economic Analysis on July 30. A stark positive rate of change from the -0.5% growth of Q1.
And it was correct to expect inflation to tick higher in June, with the number coming in at 2.7% — a four-month high. Now you should expect it to be flattish for July before leveling out and cooling off as 2026 comes into view.
Did stocks generally like that rising inflation and growth?
You betcha!
Since the day that June issue was published the S&P 500 has added ~6% and hit new all-time highs. The NASDAQ has added ~10% and hit new all-time highs. Bitcoin has added 12% and hit new all-time highs.
The market is no longer lost in Trump tariff translation. That was four months ago.
The stock market, as it does, is now looking ahead.
It’s looking ahead to the return of easy money. The market was pricing in a ~50% chance of a September rate cut before the significant downward revisions in jobs numbers last week.
Now, not only is it pricing in a 92% chance of a rate cut next month, odds are 60% of another cut in October, and there’s a 50% chance you get a third cut in December.

It’s looking forward to continued growth. The Atlanta Fed’s estimate for US Q3 GDP is 2.5%. And early forecasts Q4 are looking similar.
It’s looking forward to inflation leveling off and even starting to fall. We’ll be around 2.7% in the current quarter, peaking out in Q4 near 3%, and then cooling into early 2026.
And it’s looking forward to the implementation of the Big Beautiful Bill and the growth it will drive because of tax cuts for those with money to spend.
Aren’t rate cuts and debt-increasing bills bad for the dollar and its purchasing power?
Yes, which is why the dollar index (DXY) can't get above 100. It now takes more of them to buy index funds and back to school supplies.

It’s also why gold futures broke out to fresh all-time highs north of $3,500 per ounce while I wrote this issue.

Spot gold has added $100 in a week to trade at $3,385. It has built some support at $3,275 and needs to close above $3,430 to move higher. It’s bullish and trading in range.

That range is now good enough to be driving significant earnings from the producers and royalty companies, and that’s translating into breakouts up and down the gold value chain. GDX has broken out to 14-year highs. GDXJ has broken out to 12-year highs. The charts conjure images of parabolas.

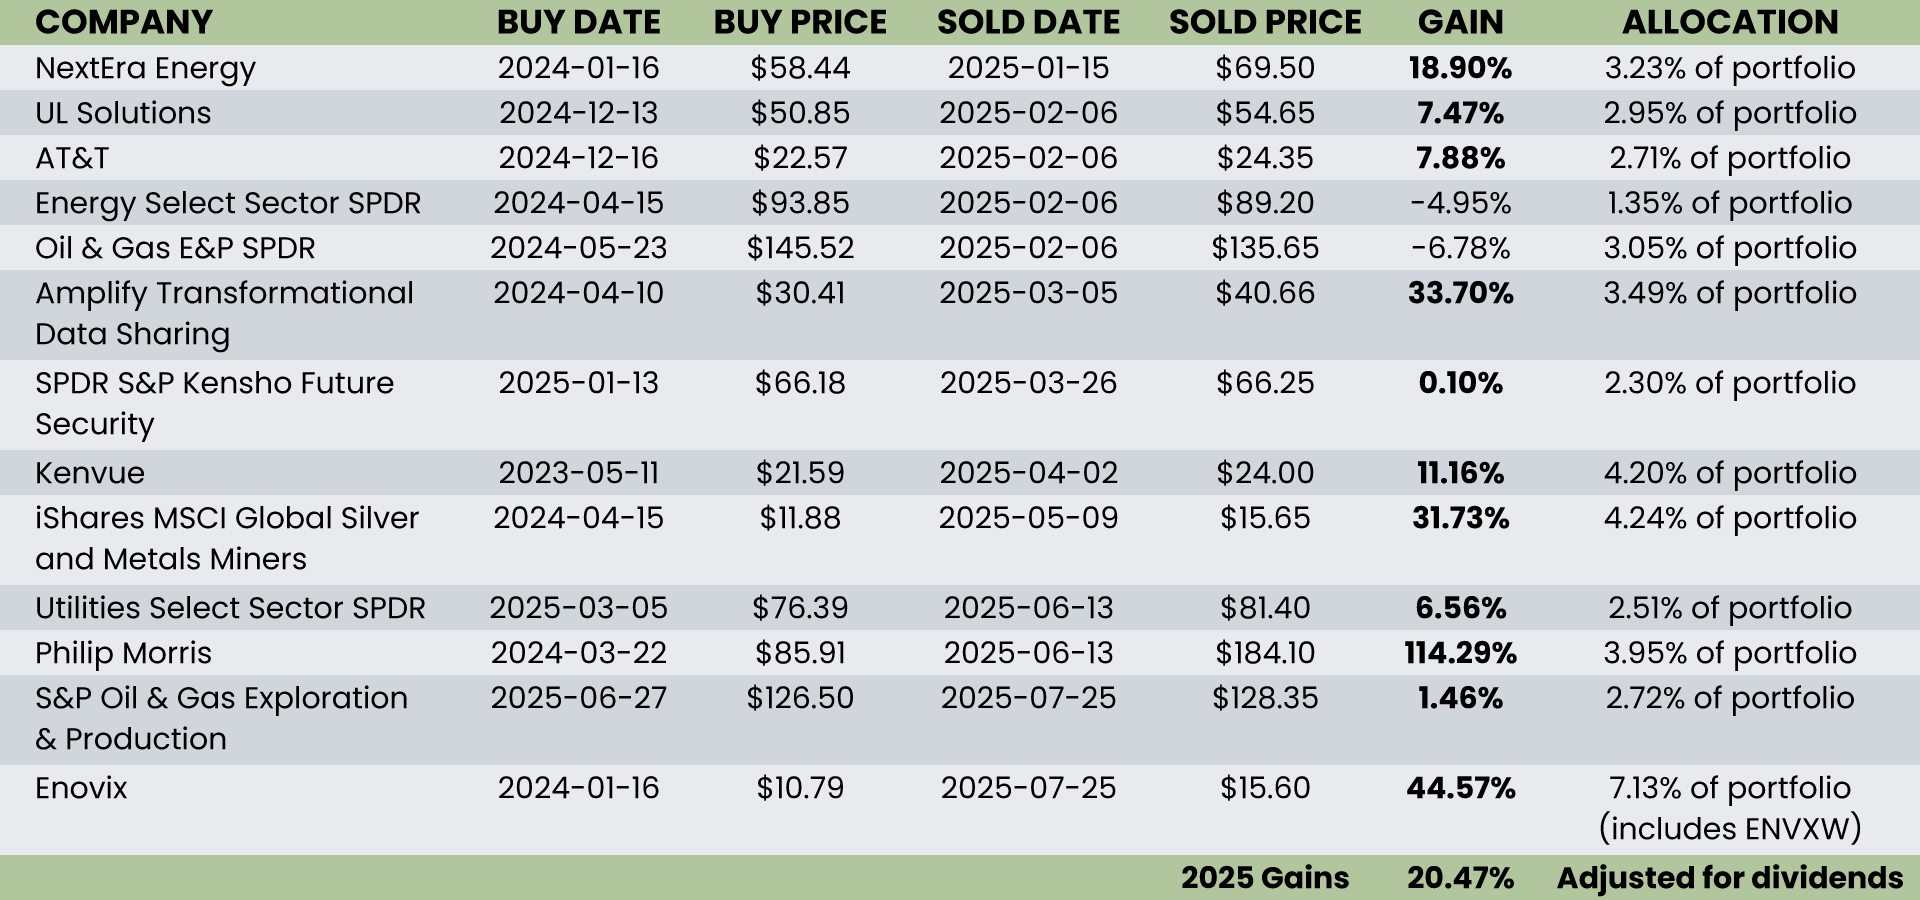
After crashes, recoveries, tariffs, and resource wars the S&P 500 is up 6.7% for the year.
Our unweighted closed portfolio sits at an average gain of just over 20%, more than three times higher.
Click here to get the current open portfolio and the eight new recommendations made in the August Issue of Foundational Profits.
This is the publication where I tell you exactly how I’m managing my long-term capital in real-time.
Call it like you see it,

Nick Hodge
Publisher, Daily Profit Cycle